Since we began our investing careers, we’ve had the concept of diversification drilled into our heads. Some refer to it as the only free lunch in investing. Well, when it comes to geography, that advice hasn’t been helpful for some time (you could say the same about value-style investing). Staying close to home and favoring the United States won’t always be the best move, but for now, we think it still is—as we discuss here.
Europe’s Economy Showing Solid Improvement
It’s been difficult to find a macroeconomic story that supports reducing exposure to U.S. equities in favor of their developed international counterparts. But frankly, if one is going to develop, it may need to happen soon.
As COVID-19 cases have fallen globally in recent months, it sets up a potentially synchronized global expansion in 2022. If that global expansion is accompanied by a weaker U.S. dollar and value stocks can at least hold their own, then we think developed international equities could be in a fairly good position to potentially outperform U.S. equities.
As shown in Figure 1, the consensus forecasts for gross domestic product (GDP) growth in 2022 are calling for the European economies (the Eurozone and the United Kingdom) to grow faster than the United States next year. Europe and Japan are both ahead of the United States right now in vaccinations administered as a percentage of their populations (source: Ourworldindata.org), after playing some catch-up, which positions those economies to take the next step forward in their recoveries. Europe and Japan are also earlier in their economic cycles, leaving more upside in terms of growth potential.
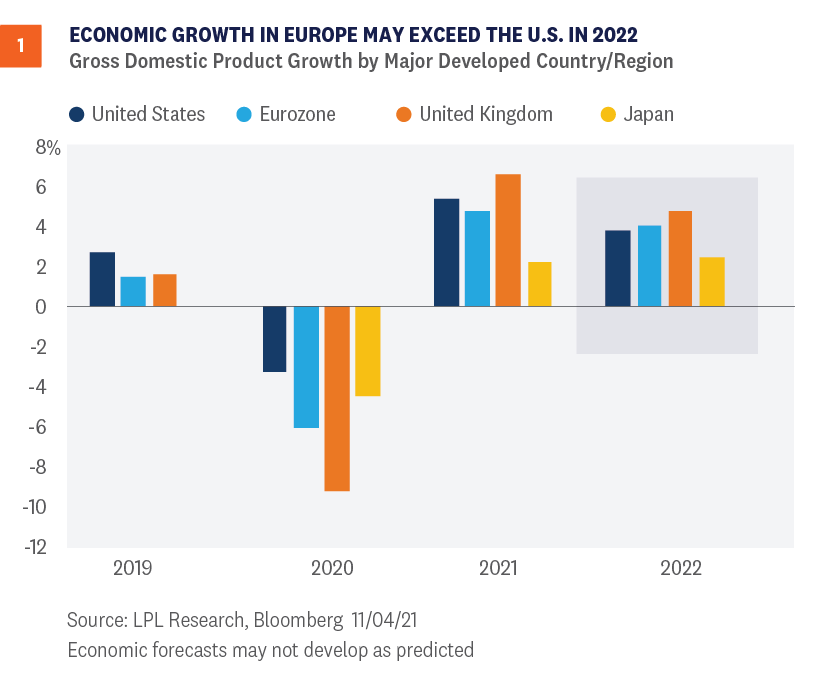
Forecasts for economic growth in Europe do look a bit better on a relative basis next year, and economic growth expectations for the second half of 2021 have held up relatively well recently despite the COVID-19 Delta variant wave, based on Bloomberg’s consensus GDP forecasts. However, Europe’s economic momentum may be peaking based on purchasing managers’ index data. Moreover, the Citi Economic Surprise Index for Europe stands at -51.5, compared to the one-year average of +90. In other words, European economic data has been mostly falling short of expectations and even missing more frequently than the U.S., where the surprise index reading is -20.5. Japan’s surprise index is also weak at -79.
With solid economic growth expected in Europe, perhaps even slightly better than in the U.S., a neutral view (or market weight) has solid support. But with momentum in Europe likely past its peak and growth in Japan lagging behind, the case for a more positive view of international equities is not particularly compelling.
International Earnings Look Good, But So Does The U.S.
Similar to the economic growth picture, earnings are recovering nicely in Europe and Japan, but they don’t stand out relative to the United States. As major global economies recover from the pandemic, MSCI EAFE Index earnings are poised to grow nearly 50% in 2021, though that is only a few percentage points better than the U.S., based on the latest consensus estimates from FactSet (and those are just estimates at this point).
Estimate revisions have been more positive in the U.S. than internationally, indicative of better earnings momentum and offsetting the attraction of the extra bit of earnings growth potential. So, at this point we’ll call earnings a toss-up, though perhaps the U.S. has a slight edge given its track record of surpassing expectations and heavy exposure to technology, e-commerce, and digital media.
Waiting For Value Stocks To Have Their Day
Perhaps the biggest problem for international equities right now in their more than decade-long struggles to keep up with the United States is the leadership of growth-style equities. Over the last 10 years, the Russell 1000 Growth Index has outpaced its Value counterpart by about 6.5 percentage points per year, while the MSCI EAFE has lagged the S&P 500 Index by about 8 percentage points per year.
The MSCI EAFE Index for non-US developed market equities has only a 10% weighting in the technology sector, compared with 28% in the S&P 500, making it very difficult for developed international equities to keep up with the U.S. in a growth-led market. Add in internet retail and digital media, and the gap between these two markets gets even bigger.
We believe a pickup in economic growth globally over the next quarter or two will help value stocks at least match returns for the growth style, with cyclically oriented value stocks potentially doing even a little better—a key ingredient for developed international equities’ prospects. But as long as U.S. growth stocks are leading, developed international will have a very difficult time keeping up over any meaningful period.
Technical Trends Stay With The U.S.
The technicals for international equities also support an overall cautious stance. As shown in Figure 2, the MSCI World Ex-U.S. Index, an index that incorporates both foreign developed and emerging markets, has continued to substantially lag the S&P 500, continuing the relative downtrend that had been in place prior to the pandemic.
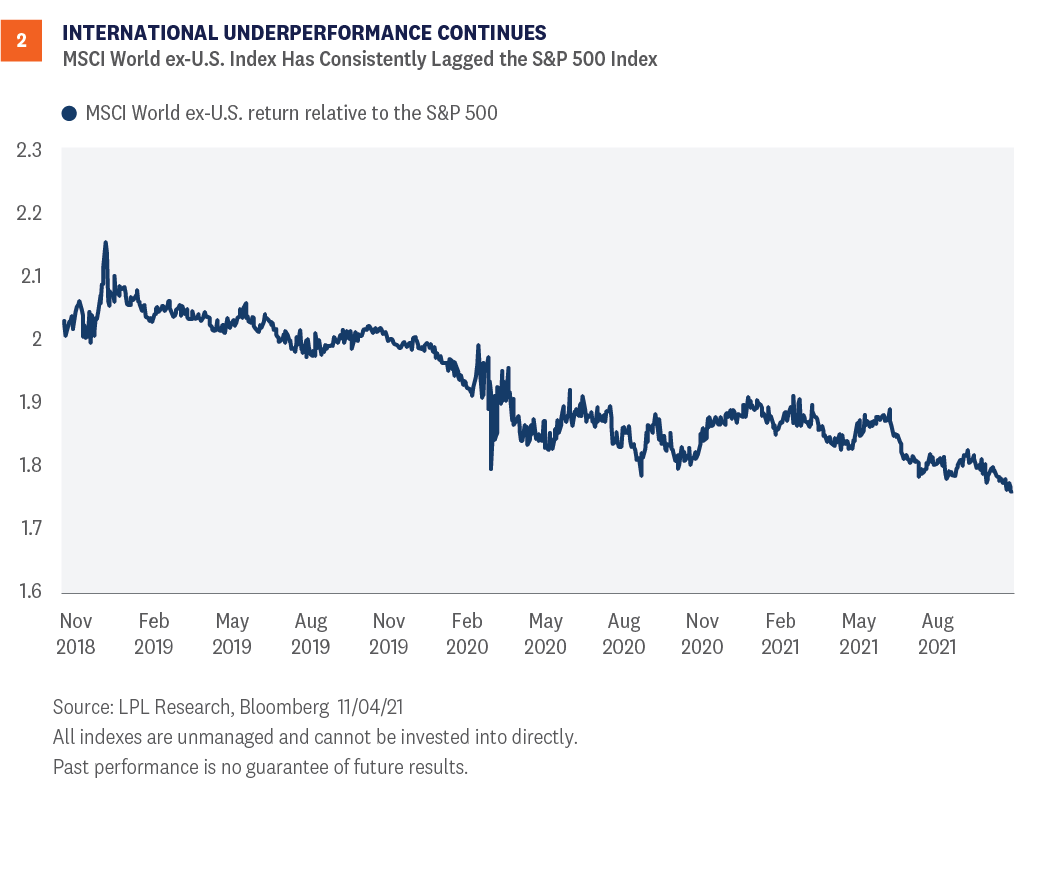
Dollar strength in 2021 is one reason for this, with the U.S. Dollar Index up more than 5% so far this year. Dollar strength hurts internationally diversified U.S. investors, as the currencies they are holding weaken relative to the dollar. However, even accounting for currency effects, international markets have steadily underperformed their U.S. counterparts, with China being one of the biggest culprits. China’s substantial weight in diversified emerging markets indexes is the primary reason the asset class has posted a slight loss so far this year.
Looking forward, we see modest signs of technical improvement in China and international markets, but the accompanying chart shows the significant opportunity cost relative to the U.S., and would likely need to show some technical improvement, combined with an abatement of dollar strength, for us to consider a positive view of developed international (or overweight), or to reconsider our underweight recommendation for emerging markets.
Still Looks Like a Value trap
One of the most popular arguments in favor of investing in developed international equities has been valuations. Based on forward price-to-earnings ratios (PE), the MSCI EAFE Index is trading at a 27% discount to the S&P 500—the largest in the past 20 years and much larger than the average long-term discount of 9%.
But stocks in Europe and Japan have been cheap for a long time, and it hasn’t helped relative performance. Valuations generally don’t tell us much about the next year or two, so we would need more reasons to re-allocate from U.S. equities to international than just low PE ratios. However, lower valuations have historically been well correlated with long-term returns, suggesting strategic investors who are in it for the long haul may benefit from international equity allocations.
Conclusion
If developed international market equities are going to outperform, we’re probably getting close to the point in time where we start to see it. Markets may be on the cusp of another rotation to value as global growth picks up, while economic growth in Europe, the majority of the MSCI EAFE Index, may exceed that of the U.S. next year.
However, we still favor the U.S. over developed international markets as we enter 2022—primarily due to technical factors, including the weak momentum for the major stock indexes outside the U.S., the strong U.S. dollar, and continued strength in U.S. growth stocks, which makes it hard for the more value-oriented markets in Europe and Japan to keep up. For developed international markets, neither economic growth nor earnings stand out relative to the U.S., so sticking with what’s been working makes sense.
Finally, our emerging markets equities recommendation remains negative due to ongoing regulatory risks in China, which could slow the growth of the Chinese economy and earnings, while also increasing uncertainty.
Click here to download a PDF of this report.
IMPORTANT DISCLOSURES
This material is for general information only and is not intended to provide specific advice or recommendations for any individual. There is no assurance that the views or strategies discussed are suitable for all investors or will yield positive outcomes. Investing involves risks including possible loss of principal. Any economic forecasts set forth may not develop as predicted and are subject to change.
References to markets, asset classes, and sectors are generally regarding the corresponding market index. Indexes are unmanaged statistical composites and cannot be invested into directly. Index performance is not indicative of the performance of any investment and does not reflect fees, expenses, or sales charges. All performance referenced is historical and is no guarantee of future results.
Any company names noted herein are for educational purposes only and not an indication of trading intent or a solicitation of their products or services. LPL Financial doesn’t provide research on individual equities.
All information is believed to be from reliable sources; however, LPL Financial makes no representation as to its completeness or accuracy.
U.S. Treasuries may be considered “safe haven” investments but do carry some degree of risk including interest rate, credit, and market risk. Bonds are subject to market and interest rate risk if sold prior to maturity. Bond values will decline as interest rates rise and bonds are subject to availability and change in price.
The Standard & Poor’s 500 Index (S&P500) is a capitalization-weighted index of 500 stocks designed to measure performance of the broad domestic economy through changes in the aggregate market value of 500 stocks representing all major industries.
The PE ratio (price-to-earnings ratio) is a measure of the price paid for a share relative to the annual net income or profit earned by the firm per share. It is a financial ratio used for valuation: a higher PE ratio means that investors are paying more for each unit of net income, so the stock is more expensive compared to one with lower PE ratio.
Earnings per share (EPS) is the portion of a company’s profit allocated to each outstanding share of common stock. EPS serves as an indicator of a company’s profitability. Earnings per share is generally considered to be the single most important variable in determining a share’s price. It is also a major component used to calculate the price-to-earnings valuation ratio.
All index data from FactSet.
This research material has been prepared by LPL Financial LLC.
Securities and advisory services offered through LPL Financial (LPL), a registered investment advisor and broker-dealer (member FINRA/SIPC). Insurance products are offered through LPL or its licensed affiliates. To the extent you are receiving investment advice from a separately registered independent investment advisor that is not an LPL affiliate, please note LPL makes no representation with respect to such entity.
Not Insured by FDIC/NCUA or Any Other Government Agency | Not Bank/Credit Union Guaranteed | Not Bank/Credit Union Deposits or Obligations | May Lose Value
RES-947201-1121| For Public Use | Tracking # 1-05209658 (Exp. 11/22)